

 As you know, sometimes MWD sample data may go missing for an extended interval of time while drilling continues. In such cases, there is a gap in the sample plot for the depth interval where data went missing.
Up until now Mezintel Gamma used to fill-in (or close) the gap with a straight line. However, some users wanted to control whether or not to show such gaps, so we have provided you with a new option to do just that.
Showing Data Gaps on Plot
As of version 22.00.031 [1], you can choose whether, and when, to show any existing gaps on your plot.
You can configure this option in System Configuration on the Mezintel Gamma Start window:
- Click >>More to see more configuration options.
- Click System
→ The grid frame shows options for system settings. - On the grid, click
 on the Depth Tracking row to expand it.
 - To show gaps on plot:
- On the Minimum Gap Feature row, double-click the value column and select YES.
- On the Minimum Gap Distance row, double-click the value column to select an activation threshold value between 5m and 10m.
→ Any gaps longer than this value (in meters) will show on the log plot.
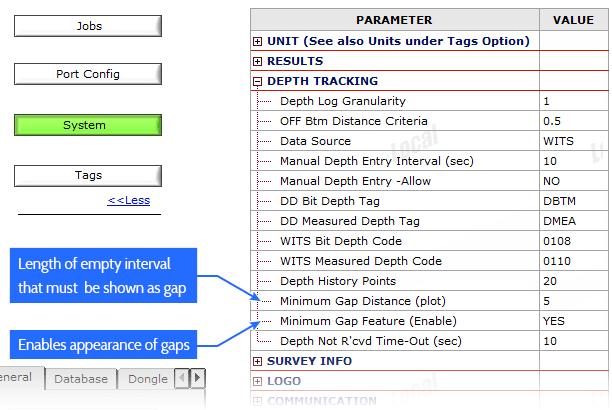
Above settings will cause a gap to show up if data goes missing for 5 meters or more (assuming that depth unit is in meters).
To avoid gaps and keep a straight line just set Minimum Gap Feature (Enable) = NO
Need to Upgrade?
1^ This option to show plot gaps was introduced in version 22.00.031 (Mar. 13, 2014).
If your Mezintel Gamma is outdated, you can use the online auto-upgrade to get the latest version.