Author Archives: Mezintel

LWD Log Headers – 3 Styles to Suit Your Requirements

Mezintel Gamma features three LWD log header styles with variation in format, bit run holding capacity, and content (e.g. emphasis on either casings info or mud properties).
A brief summary of these three headers is as follows:

1. Standard Header

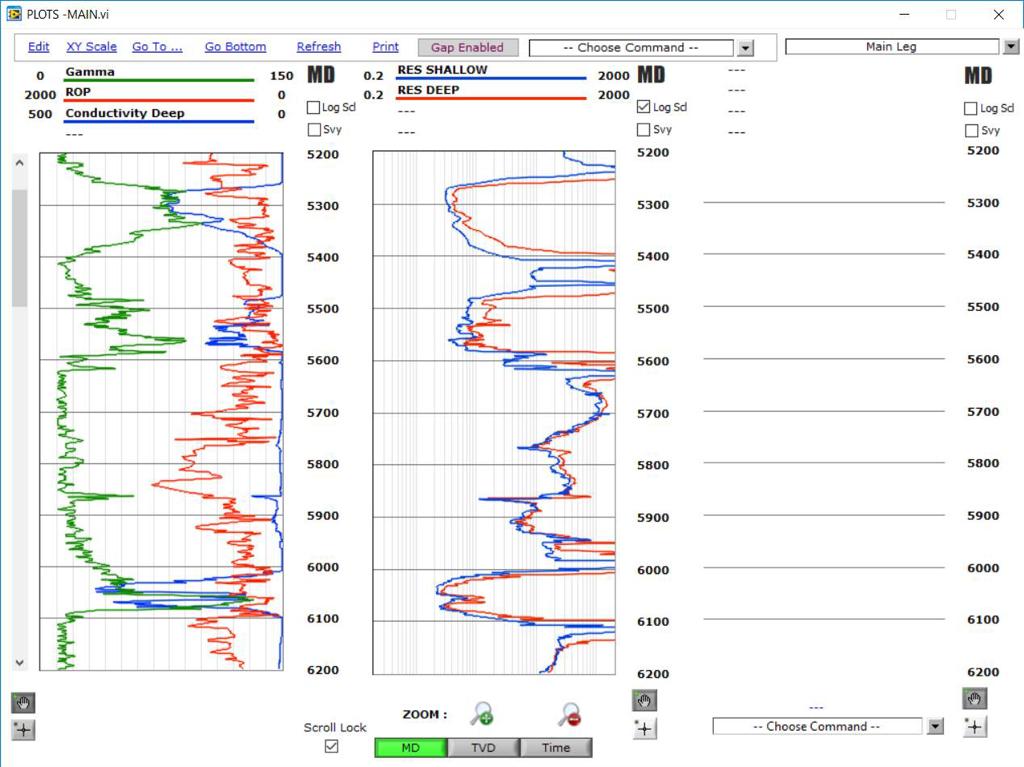
LWD Log Header

Basic header for logs with 6 bit runs maximum.

The standard header is a brief, suitable for short jobs with a maximum of six bit runs. This header includes all baseline info for an MWD/LWD drilling job as shown here.
Continue reading

Correcting Corrupted Proctor Data in Field Compaction Tests

In BreakTest’s field density form, applying a proctor (from the Proctor lookup list) to a test results row automatically adds a summary of that proctor to the “Soils Description” list on the form. With this in mind, consider a scenario where a proctor referenced in the test results table is missing it’s corresponding summary on the soils description list, or vice-versa.

Only proctor data 770 has matching summary "Description B - 770..."

Proctor data in row #3 has a matching summary “Description B – 770…”
Proctor data in rows #1 & #2 (1500…) have no matching summary, and “Description A -Edited Proctor – 1700…” has no matching proctor data on the results table. What is going on here?

Continue reading

Switching Between MWD Tags and WITS for Communication

The job templates in Mezintel Gamma software are preconfigured to understand appropriate data formats for each MWD platform / system.
So for example, if you choose the XXT Template then your job will only understand incoming MWD data in the form Tag data (i.e. qTalk):

Gamma = Value

This configuration is correct if your Mezintel Gamma PC is receiving data directly from the XXT device, but if the data is coming from an XXT PC then that data is actually WITS data.
Continue reading

IFR Surveys Correction for MWD

hand-adjusting-compass
In-Field Referencing (IFR) technology has been applied in directional drilling since at least the early 2000s. Being particularly useful for drilling tightly spaced lateral wellbores, there’s a been a recent surge in demand for this technology, hence requiring more MWD service providers to work with IFR surveys.
IFR surveys has been supported in Mezintel Gamma logging software since 2013, so customers have been able to handle this demand fine. And with increased usage came requests for features and improvements. This article provides an overview of these improvements, but before doing so… what are IFR surveys?
Continue reading

Finding ‘Check Survey’ Spots

MWD operators often need to match surveys to particular points in a run. A common example of this is during ‘check survey’, which is recommended to be done near the last MWD survey on the previous run. For check survey, finding the last survey on the previous run is fairly straightforward since that survey is probably the very last survey done.
But how about when you need to identify survey locations beyond that, on preceding runs?
Continue reading

The New Proctor Test in BreakTest

The proctor method Moisture-Density Relationship test is now available in BreakTest.
It features a worksheet for the lab measurements, a proctor curve fit tool, and the PDF report which is delivered to the customer.
This proctor test module is based on ASTM698 and ASTM D1557 specification.

Key Features of the Proctor Test Module

Form Auto-Fill & Calculations:

As with all e-forms in BreakTest, the proctor test form is auto-filled with its project info as predefined.
Also, repeating test data (e.g. Volume and Weight of Mold) is auto-filled, and derived data (e.g. Wet and Dry Densities) are auto-calculated on the form.
Proctor test e-form, project info, CC list, Lab test data

Continue reading

Getting E-Signature File Into BreakTest

About E-Signatures

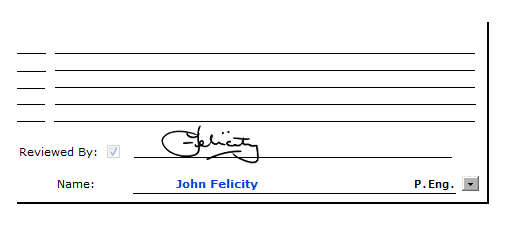
An E-Signature stands for: Electronic Signature, and it is an image file of one’s signature that shows up on BreakTest reports after clicking the ‘Reviewed By’ check box. A user must have signatory rights for the ‘Reviewed by’ check box to appear.

An example of an electronic signature is the one shown below

E-Signature showing on a BreakTest Report.

E-Signature showing on a BreakTest Report.


Continue reading

New Tools and Features For ECD Calculation

Mezintel Gamma has new tools and features for ECD Calculation!
Illustrated below, are the new features and tools to help you get the job done:

Tool to Hand Bomb Values into the Software

This new tool will allow you to generate the exact values that you need to show in the Mezintel Gamma program. This tool can be used in the shop to test ECD calculation without having the decoder or depth tracking system attached.
The below screen shot illustrates how to deploy this tool. After the window opens, you can send any data that you want to Mezintel Gamma software.
Simulation Using Manual Data Entry
Continue reading

Building Mezintel Gamma Log With Default Minor And Major Increments

With Mezintel Gamma version 22.33.128, users have access to a utility for auto printing reports that enables the input of default minor and major increments. Please note that minor and major increments must be inputted and saved with each new job. The below figure demonstrates utilization of this utility to input default minor and major increments for a job.
Configuring Plots via Auto-Reporting Feature
Alternatively, this can also be achieved utilizing manual printing.

WITS Simulator for Drilling Depth Data

Often MWD operators and tool engineers need to simulate WITS data for depth. Depth simulation may be needed for training or shop testing where a depth tracking system (DTS) is not available, or for troubleshooting communication with a present DTS or EDR.
Mezintel Gamma software offers in-app simulation for both MWD and depth data, and this feature may suffice for training and testing purposes. However, how about in certain testing or troubleshooting scenarios when there’s need to simulate data as well as its transmission via a communications port — as would be with a depth tracking system or EDR?
In such cases, a dedicated WITS simulator application is very useful.
Continue reading

LabVIEW Queued State Machine
Producer-Consumer Architecture

By: Anthony Lukindo, Mezintel Inc. Calgary AB, Canada — September 24, 2007

  QSM PC Example (.LLB)
  Download as Document

Summary

The Queued State Machine -Producer Consumer Architecture; abbreviated in this article as QSM –PC is one essential architecture that significantly facilitates the programming of mid-sized to advanced LabVIEW –based projects that constitute 100 or more VIs. In light of the intermediate to advanced nature of the objects that make up the QSM –PC architecture, taking full advantage of this design template requires detailed knowledge of the why’ and ‘how’ of the various design aspects that characterizes this template. This article defines, illustrates, and describes at length the various elements of the QSM –PC architecture.
Continue reading

Printing a Select Set of Test Rows

Once the reviewer approves test results in BreakTest, signing the test reports automatically archives them as PDF files. These PDF reports are snapshots of the e-form as it was when it was signed, and are ready to be emailed to the client.
For field density tests however, there may be times when you are required to provide your client with only a select set of the test rows on the report. You can do this by selecting the rows you want, and printing only those.
Continue reading

Working on a Select Set of Test Rows

Working with Select Rows
In BreakTest, concrete and soils test results are recorded on a long running table list on their e-forms (the list is broken up to fit letter-size pages for reporting). This continuous list simplifies managing the test results.
However, the list can get quite long for field density tests, and there are times when you need to work on certain field density test rows, and skip others. For example, you may need to assign proctors to only a set of applicable rows. Or if you’re approving the test results, you may need to skip certain rows due to inaccurate information. More purposes for this capability follows later in this article.
Continue reading

WITS Format as used by Mezintel MWD Products

  Download as Document

Mezintel Depth Tracker streams out ASCII data every 4 seconds via a 9-pin RS-232 male serial port. This data is in WITS format.

WITS (Wellsite Information Transfer Specification) is a 20 year old worldwide oil and gas industry standard that specifies how to format text-based (ASCII) drilling data for transmission between two devices connected by serial ports (RS-232) or by an Ethernet link.
Continue reading

Sign Test Reports Digitally to Maximize Automation

Signing auto-prepares report for sending

A signature of approval authorizes specified subsequent actions.

In the field of materials testing, by signing a test report the signatory is saying that it is okay to archive and send the test results to stakeholders. In addition to placing the signature on the form, digital signing should do more to make any subsequent authorized tasks as seamless as possible. This means taking advantage of the computer to boost productivity by:

  • Eliminating manual handling of the test reports
  • Streamlining the process of distributing approved reports to customers

Continue reading

Average ROP: How to Smoothen ROP Plot

In drilling, there are two are two main ways to interpret the rate of penetration (ROP): Instantaneous and Average. Here are good definitions of the two:

Instantaneous ROP is measured over a finite time or distance, while drilling is still in progress. It gives a snapshot perspective of how a particular formation is being drilled or how the drilling system is functioning under specific operational conditions.
Average ROP is measured over the total interval drilled by a respective BHA from trip-in-hole (TIH) to pull-out-of-hole (POOH).
G. Mensa-Wilmot and Y. Harjadi

A Smoother Plot

Average ROP is important because it’s a key factor to consider when discussing drilling efficiency, plus it produces a cleaner plot than instantaneous ROP.

Averaging points produces a cleaner plot.

Averaging points produces a cleaner plot.


Continue reading

Improved Workflow for Breaking Concrete Samples

A Need to Better Manage Daily Breaking of Concrete Samples Uncovers and Resolves Other Workflow & Productivity Issues

A customer using spreadsheet concrete reports with some automation via macros scripts looked to Mezintel’s BreakTest for new ways to:

  1. Print daily cylinder break schedule
  2. Automatically populate individual reports with strength data filled-in from daily break forms.

Continue reading